
Network Mapping: Mapping the Who
26 Oct 2022

The fields of network mapping and urbanism have not traditionally made for close bedfellows but that is changing with the advent of cultural mapping that is changing. Drew Mackie joins the dots on how to apply social network mapping to the owners, developers, managers, users and ‘regulators’ of public spaces in the city.
There is a current vogue for non-geographic mapping in the UK. Increasingly, the term is used to describe any kind of description[a] and quantification of an activity or set of actors. Confusingly, this can refer to products that have no ‘maps’. Cultural mapping is often just a set of descriptions and statistics. I have a visual imagination. I want to see a picture that shows the extent and structure of the subject being mapped. As Donella Meadows, the US systems guru put it:
‘‘Words and sentences must, by necessity, come only one at a time in a linear, logical order. Systems happen all at once. They are connected not just in one direction, but in many different directions simultaneously. To discuss these properly, it is necessary somehow to use a language that shares some of the same properties as the phenomena under discussion. Pictures work for this language better than words because you can see all the parts of the picture at once.”
(Donella Meadows, Thinking in Systems, 2008)
Traditionally, maps have been geographic. They showed where places were and measured distance, area and height of objects in a landscape. Modern online geomaps will also record a broad range of data on the map elements. They map the What and Where and sometimes the When. Network maps (netmaps for short) on the other hand, look at the Who and go some way to explaining the Why of the actions and actors covered by the map.
Think of an area of green space in a neighbourhood. While a geomap will show how big it is, how near to other facilities and perhaps its areas of woodland and water, a netmap will show who owns it, who funds it, who maintains it and who uses it - and will chart the collaborative connection patterns between these actors, often showing change over time.
A netmap consists of a set of nodes and connections representing organisations and individuals, or sometimes concepts and conversations. The definition of a network is: ‘Anything that can be represented as a set of nodes and connections’. Such mapping has been applied in a wide spectrum of fields from policing to microbiology to political campaigning to military strategy. Netmaps are not just visualisations. Software can measure the overall connectivity of a network and identify which nodes are most central to its operation. It can display the ‘natural clusters’ of nodes that hang together because of patterns of connection and show how these change over time. In a world where funders will often see increases in community connectivity as a major goal of projects, this can provide metrics for evaluation.
What do the Who do?
Defining who is important to your interests and activities is obviously useful, but often the real influencers in a network are not immediately identifiable. Some nodes may have plenty of resources but are not central to the network and others may be central but don’t have the assets to exploit that centrality. Others may be central and have resources, but just don’t choose to exercise that potential.
In planning urban places we tend to concentrate on physical and systems design - the space and its immediate uses. But we also need to think of who manages, develops, uses, funds and controls the space.
We need also to be aware that the mix of influencers changes over time. A place will have different users at different times of day, and these may change over the seasons of the year. Certain influencers will have great traction during the early existence of a space and that may change over time.
The point about all this is that you can explore and track these influences and changes using network mapping.
Centrality
Netmaps can identify who is most central to the network and therefore more capable of influencing it and distributing information. Using specialised software which can both draw and analyse the map we can identify the most central nodes.
Closeness centrality measures the distance each element is from all other elements. In general, elements with high closeness can spread information to the rest of the network most easily and usually have high visibility into what is happening across the network.
Betweenness centrality measures how many times an element lies on the shortest path between two other elements. In general, elements with high betweenness have more control over the flow of information and act as key bridges within the network. They can also be potential single points of failure.
Eigenvector centrality measures how well-connected an element is to other well-connected elements. In general, elements with high eigenvector centrality are the leaders of the network, though they may not have the strongest local influence.
Clustering
Actors on the map will cluster because of how they are positioned on the map. The patterns of connection will determine these clusters, and they can be very useful in planning a campaign or getting your message out to the people and organisations on the network.
Reading a netmap
Remember the first time you looked at a spreadsheet. Wow, that looks really complicated! But over time you learned to read a spreadsheet, just as you originally learned to read a book. It’s the same with a netmap. At first, it looks really complicated and messy. But gradually you learn how to read its patterns and to use Social Network Analysis (SNA) and various complex searches and filters to find your way around and recognise what the map is telling you. The best way to do this is to crash around in a safe map - one you can’t permanently damage.
‘What ifs’
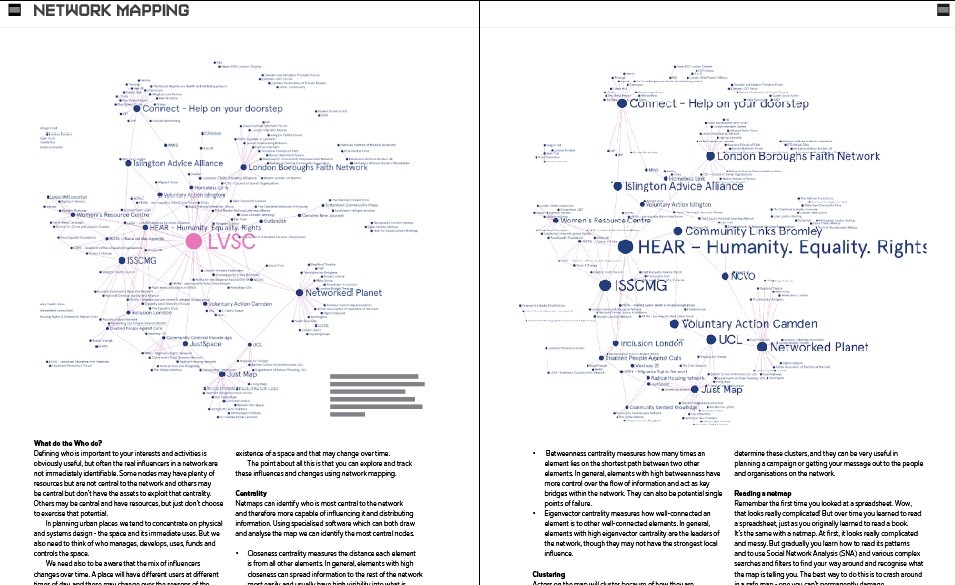
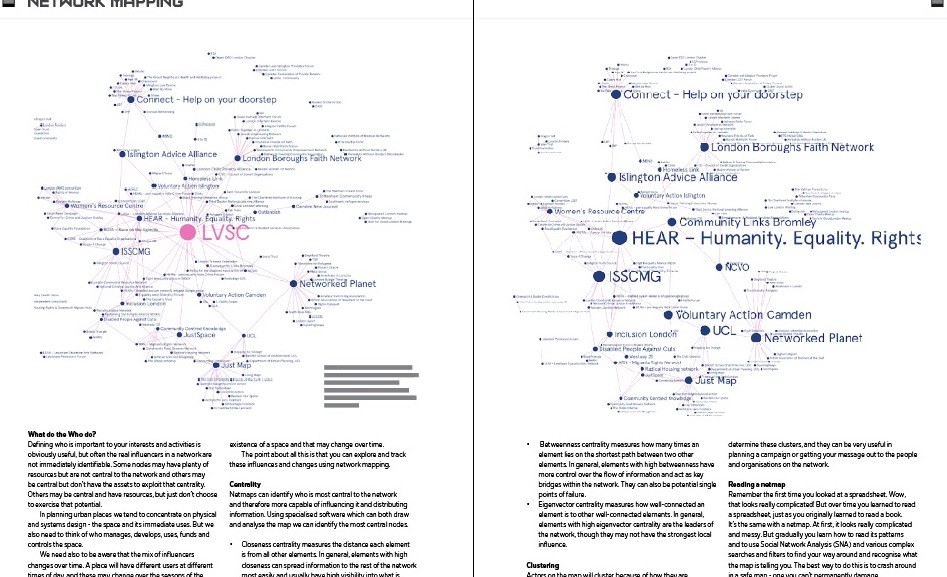
A common use of a netmap is to explore what might happen if a particular organisation ceases to be part of the network. It may have been disbanded or lost its funding or have withdrawn from the network. The network map on the left below was created at a one-day conference held by the London Voluntary Service Council (LVSC). Attendees drew on a basic netmap to add their connections and organisations. As the maps were returned I fed the responses into a computer based netmapping programme and the results were projected onto a big screen - a good way to engage participants. Shortly after the conference, LVSC was disbanded. The map on the previous page shows what other organisations were best placed to fill the LVSC role.
Slipham
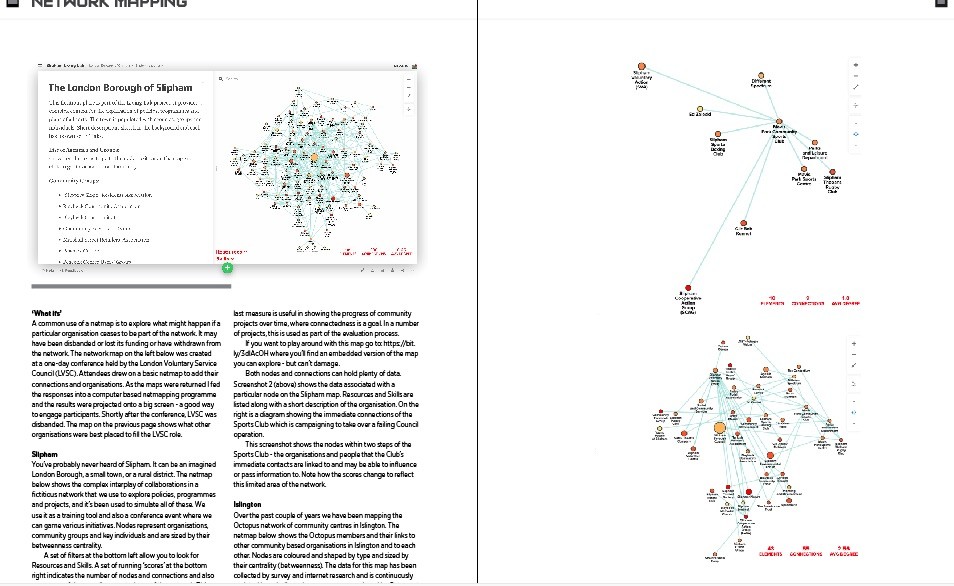
You’ve probably never heard of Slipham. It can be an imagined London Borough, a small town, or a rural district. The netmap below shows the complex interplay of collaborations in a fictitious network that we use to explore policies, programmes and projects, and it’s been used to simulate all of these. We use it as a training tool and also a conference event where we can game various initiatives. Nodes represent organisations, community groups and key individuals and are sized by their betweenness centrality.
A set of filters at the bottom left allow you to look for Resources and Skills. A set of running ‘scores’ at the bottom right indicates the number of nodes and connections and also a measure of the overall connectedness of the network. This last measure is useful in showing the progress of community projects over time, where connectedness is a goal. In a number of projects, this is used as part of the evaluation process.
If you want to play around with this map go to: https://bit.ly/3dlAcOH where you’ll find an embedded version of the map you can explore - but can’t damage.
Both nodes and connections can hold plenty of data. Screenshot 2 (above) shows the data associated with a particular node on the Slipham map. Resources and Skills are listed along with a short description of the organisation. On the right is a diagram showing the immediate connections of the Sports Club which is campaigning to take over a failing Council operation.
This screenshot shows the nodes within two steps of the Sports Club - the organisations and people that the Club’s immediate contacts are linked to and may be able to influence or pass information to. Note how the scores change to reflect this limited area of the network.
Islington
Over the past couple of years we have been mapping the Octopus network of community centres in Islington. The netmap below shows the Octopus members and their links to other community based organisations in Islington and to each other. Nodes are coloured and shaped by type and sized by their centrality (betweenness). The data for this map has been collected by survey and internet research and is continuously updated by a dedicated map manager employed by Octopus to promote and maintain the map. The menus at the bottom left of the map have been extended, but it works much the same as the Slipham map.
We use the sumApp system to collect data through online survey. sumApp automatically feeds responses into a network map which then appears as the last page of the survey with the respondent’s data included.
So What?
Typically, people will look at a netmap and say ‘Wow! That’s fantastic!’ But that’s closely followed by ‘So what? What can we DO with it? ’ Netmaps are complex and messy, reflecting a real world which is complex and messy. It takes time and effort to learn to read them and even more to learn to interpret their analysis. Netmaps are not precise records of the relationships they portray, which will change over time. They are best looked on as giving hints and insights into how the network works, which then guide you to action. A campaign can use them to establish who is most central and then try to influence them or to pass information. A netmap can be used to map the funding landscape around a particular project or programme and to suggest collaborative bids or coordinated action.
Although network mapping is only now becoming popular in the UK it has a longer history of use in the US, where it’s often used as a component in the evaluation of community based projects. Most of my own netmapping projects are in urban areas. They include:
- Mapping the funding landscape around black employment and disability in Lambeth and for a major charitable funder of its own operations.
- Analysing the issues and organisations around black unemployment in Lambeth.
- Training netmappers in the East Riding of Yorkshire to create and evaluate maps based on community sports projects and public health
- Assisting a major health charity to create a netmap of over 3,000 health improvement professionals over the UK and Ireland
- Plotting the many organisations involved in one of Europe’s largest development projects in London.
|
Back to October 2022
