
Image of the City: Atlantic Connections
17 Apr 2023

An unfashionable post war idea pioneered by American urban planner Kevin Lynch for analysing urban areas by edges & landmarks is championed by Drew Mackie. He argues it offers contemporary insights to architects on this side of the pond.
The science of networks covers many fields - policing, microbiology, communications, military strategy, community collaboration, economics, epidemiology and so on. Network theory is researched in many universities and software developed to visualise, analyse and evaluate networks of all sorts. My own interest in networks stems from the experience of several regeneration projects in the 80s and 90s. These projects would often fail in the long-term as the complex web of organisations - managers, funders, political and community actors and government bodies - didn’t join up sufficiently to make the project deliver what it had promised. This interest led to a number of network mapping exercises of such organisational networks and these now form the bulk of my work all over the UK.
But my original interest in networks was sparked by ‘A City is not a Tree’, the seminal essay by Chistopher Alexander, the British mathematician, architect and urban theorist. At that time planning was still dividing towns into industrial commercial and residential zones. Alexander described this as a treelike structure that inhibits the creative complexity of the city. At around the same time Jane Jacobs was arguing for mixed use areas where the messiness and complexity was a bonus rather than a problem. In 1959 Kevin Lynch wrote “The Image of the City”.
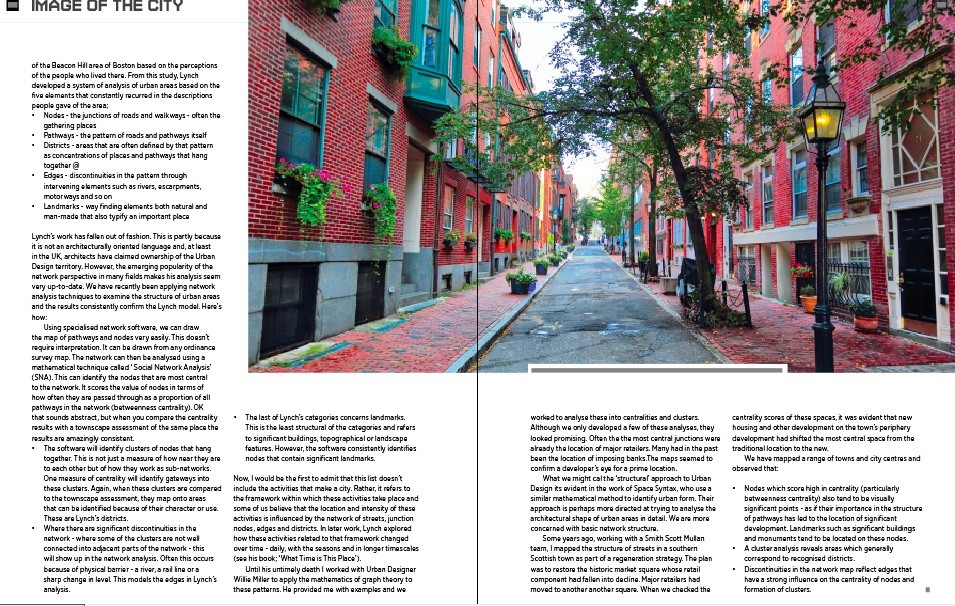
It was one of the most influential books in the newly emerging discipline of Urban Design. It described a study of the Beacon Hill area of Boston based on the perceptions of the people who lived there. From this study, Lynch developed a system of analysis of urban areas based on the five elements that constantly recurred in the descriptions people gave of the area; Nodes - the junctions of roads and walkways - often the gathering places Pathways - the pattern of roads and pathways itself Districts - areas that are often defined by that pattern as concentrations of places and pathways that hang together @ Edges - discontinuities in the pattern through intervening elements such as rivers, escarpments, motorways and so on Landmarks - way finding elements both natural and man-made that also typify an important place Lynch’s work has fallen out of fashion.
This is partly because it is not an architecturally oriented language and, at least in the UK, architects have claimed ownership of the Urban Design territory. However, the emerging popularity of the network perspective in many fields makes his analysis seem very up-to-date. We have recently been applying network analysis techniques to examine the structure of urban areas and the results consistently confirm the Lynch model. Here’s how: Using specialised network software, we can draw the map of pathways and nodes very easily.
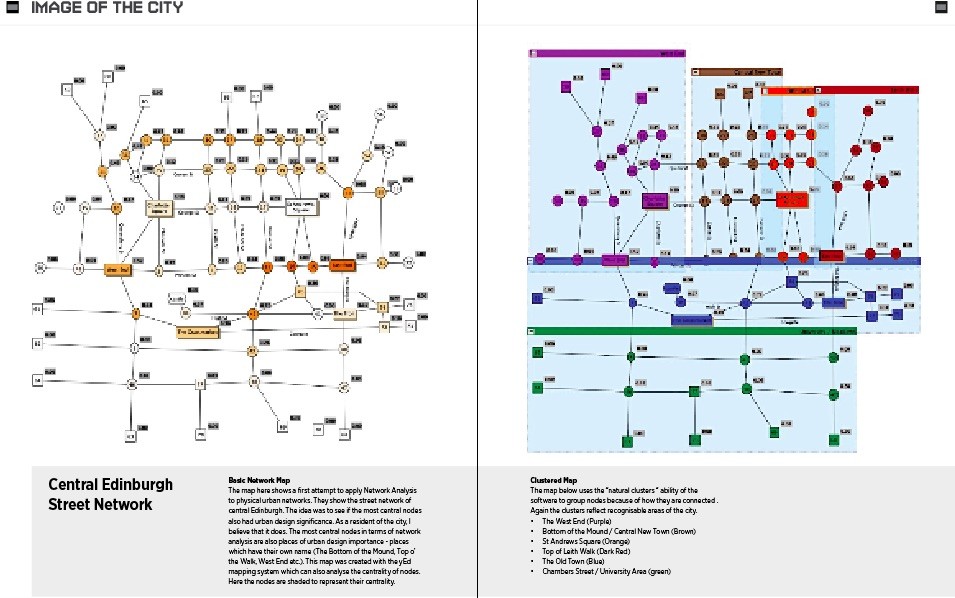
This doesn’t require interpretation. It can be drawn from any ordinance survey map. The network can then be analysed using a mathematical technique called ‘ Social Network Analysis’ (SNA). This can identify the nodes that are most central to the network. It scores the value of nodes in terms of how often they are passed through as a proportion of all pathways in the network (betweenness centrality). OK that sounds abstract, but when you compare the centrality results with a townscape assessment of the same place the results are amazingly consistent. The software will identify clusters of nodes that hang together. This is not just a measure of how near they are to each other but of how they work as sub-networks. One measure of centrality will identify gateways into these clusters. Again, when these clusters are compared to the townscape assessment, they map onto areas that can be identified because of their character or use. These are Lynch’s districts. Where there are significant discontinuities in the network - where some of the clusters are not well connected into adjacent parts of the network - this will show up in the network analysis. Often this occurs because of physical barrier - a river, a rail line or a sharp change in level. This models the edges in Lynch’s analysis.
The last of Lynch’s categories concerns landmarks. This is the least structural of the categories and refers to significant buildings, topographical or landscape features. However, the software consistently identifies nodes that contain significant landmarks. Now, I would be the first to admit that this list doesn’t include the activities that make a city. Rather, it refers to the framework within which these activities take place and some of us believe that the location and intensity of these activities is influenced by the network of streets, junction nodes, edges and districts.
In later work, Lynch explored how these activities related to that framework changed over time - daily, with the seasons and in longer timescales (see his book; ‘What Time is This Place’). Until his untimely death I worked with Urban Designer Willie Miller to apply the mathematics of graph theory to these patterns. He provided me with examples and we worked to analyse these into centralities and clusters. Although we only developed a few of these analyses, they looked promising.
Often the the most central junctions were already the location of major retailers. Many had in the past been the location of imposing banks.The maps seemed to confirm a developer’s eye for a prime location. What we might cal the ‘structural’ approach to Urban Design its evident in the work of Space Syntax, who use a similar mathematical method to identify urban form. Their approach is perhaps more directed at trying to analyse the architectural shape of urban areas in detail. We are more concerned with basic network structure. Some years ago, working with a Smith Scott Mullan team, I mapped the structure of streets in a southern Scottish town as part of a regeneration strategy. The plan was to restore the historic market square whose retail component had fallen into decline.
Major retailers had moved to another another square. When we checked the centrality scores of these spaces, it was evident that new housing and other development on the town’s periphery development had shifted the most central space from the traditional location to the new.
We have mapped a range of towns and city centres and observed that:
- Nodes which score high in centrality (particularly betweenness centrality) also tend to be visually significant points - as if their importance in the structure of pathways has led to the location of significant development.
- Landmarks such as significant buildings and monuments tend to be located on these nodes. A cluster analysis reveals areas which generally correspond to recognised districts.
- Discontinuities in the network map reflect edges that have a strong influence on the centrality of nodes and formation of clusters.
|
Back to April 2023
